
Why isn’t your RC boat hitting the speeds you expected? You might have a powerful motor, but that’s not the whole story.
Propeller RPM is the key—and “bigger motor equals faster boat” doesn’t always work. Your RC boat’s propeller rotation speed depends on at least seven different factors working together. Motor KV rating and battery voltage matter. So do gear ratios and propeller blade design, which many people overlook.
Miss one of these factors? You’ll waste money on parts that don’t match. Or you’ll lose serious performance.
Racing for podium finishes? Want your weekend cruiser to run right? Understanding these RPM factors changes everything. You go from buying random parts to building real performance.
Here’s the technical breakdown that makes those confusing spec sheets clear.
Content Framework for “Which Influence The RC Boat Propeller Rpm”
Seven core factors control your propeller’s rotation speed. Each one acts like a gear in a precision watch. Change one, and everything else shifts.

Motor KV rating sits at the center. This number tells you how many RPMs your motor produces per volt. Pair a 3000 KV motor with an 11.1V battery, and you’re looking at around 33,300 RPM unloaded. Add a propeller, and that number drops fast.
Battery voltage feeds the system. More volts mean more RPM—simple physics. A 7.4V LiPo versus an 11.1V? That’s the gap between slow starts and quick acceleration.
Propeller diameter and pitch create the load equation. Bigger diameter or higher pitch propellers need more torque. This slows rotation. A 3-inch propeller needs 20,168 RPM to hit 180 MPH tip speed. Scale up to 15 inches at 11,000 RPM, and you’re generating 490 MPH at the tips. The math matters: power absorption increases with diameter to the 5th power and RPM cubed.
Gear ratio modifies the final output. A 2:1 reduction cuts motor RPM in half. But it doubles torque to the propeller shaft.
ESC settings control power delivery. Timing adjustments and throttle curves change how voltage converts to rotation.
Water resistance and propeller blade design complete the framework. These decide how well your RPM translates into actual thrust.
Motor KV Rating and Battery Voltage: The Primary RPM Drivers
The formula looks simple: Theoretical no-load RPM = KV × Battery Voltage (V). This equation controls everything your RC boat does on the water.
KV rating tells you how many revolutions per minute your motor spins for every volt you feed it. A 1000 KV motor hits 1000 RPM per volt. A 2300 KV motor? That’s 2300 RPM per volt. The number is direct. No hidden math. No marketing tricks.
Take that KV number and times it by your battery voltage. You get theoretical maximum RPM. A 2300 KV motor with a 4S LiPo battery (14.8V) gives you 34,040 RPM. Swap to a 6S battery (22.2V) with the same motor. You jump to 51,060 RPM. Same motor. Different voltage. Huge RPM gap.
|
Motor KV |
Battery Voltage |
Theoretical RPM |
|---|---|---|
|
1000 KV |
12.6V |
12,600 RPM |
|
2300 KV |
14.8V (4S) |
34,040 RPM |
|
2300 KV |
22.2V (6S) |
51,060 RPM |
|
1750 KV |
22.2V (6S) |
38,850 RPM |
|
2700 KV |
11.1V (3S) |
29,970 RPM |
Here’s the catch: actual loaded RPM drops 10% to 30% below that theoretical number. Propeller load eats RPM. Water resistance drags it down. Battery voltage sag under throttle cuts performance even more.
The Physics Behind KV Ratings
KV and torque work in opposite directions. High KV motors pack fewer winding turns. They generate less back EMF and spin faster. But they produce less torque per revolution. Low KV motors do the opposite. More winding turns create stronger magnetic fields. They also create higher back EMF. The result? Lower RPM but much greater torque.
Think of it like gearing on a bicycle. High KV is like a tall gear. Fast spinning, less power. Low KV is the granny gear. Strong acceleration, slower rotation.
Winding count sets your KV. More wire turns around the stator reduce KV. Fewer turns increase it. Magnet strength plays a role too. Stronger magnets lower the KV rating in most cases. Core materials, resistance levels, and motor build all fine-tune the final number.
Battery Voltage: The RPM Multiplier
LiPo cells deliver 3.7V each after charging. Stack three in series (3S), and you get 11.1V. Four cells (4S) give 14.8V. Six cells (6S) push 22.2V. Voltage goes up with cell count. So does your propeller rotation speed.
The problem? Voltage sag under load ruins your RPM math. Batteries with weak discharge rates (low C ratings) can’t hold voltage under full throttle. That 22.2V battery might sag to 19V under full load. This cuts 3,000+ RPM in a flash.
Racing setups need 75C+ discharge ratings for this exact reason. The battery holds voltage stable even under massive current draw. Weekend cruising? You can use 50C batteries. But competitive racing has no room for voltage drop.
Battery health matters as much as specs. Old cells with high internal resistance sag harder than fresh packs. You’ll see theoretical RPM on paper. But your actual shaft speed shows a different picture. A worn 6S battery might perform worse than a healthy 4S pack. Same KV motor, lower real output.
The relationship is pure math. But the performance impact hits hard. Get the KV-voltage pairing wrong? You’re either dragging a slow boat or burning parts trying to push too hard.
Gear Ratio: How Transmission Affects Propeller Rotation Speed
Gear ratio translates your motor’s fast spinning into useful propeller work. This single number—expressed as 2:1 or 1.5:1—decides if your setup creates strong acceleration or weak thrashing.
The math is simple: Propeller shaft RPM = Motor RPM ÷ Gear ratio. A motor at 30,000 RPM paired with a 2:1 reduction gives 15,000 RPM to the propeller shaft. That same motor with a 1.5:1 ratio? You get 20,000 RPM at the shaft. The reduction ratio cuts speed but multiplies torque by the same amount.
Here’s where most builders get it wrong. Higher gear ratios slow shaft rotation but boost torque output. A 2.33:1 reduction drops your propeller RPM quite a bit compared to a 1.5:1 setup. But that extra torque lets you use a larger propeller without stalling the motor. Lower ratios work the other way—faster shaft speeds with smaller props and less power.
|
Gear Ratio |
Motor at 24,000 RPM |
Shaft RPM |
Propeller Size |
Performance Character |
|---|---|---|---|---|
|
1.5:1 |
24,000 |
16,000 |
Smaller (40-50mm) |
High speed, quick response |
|
2:1 |
24,000 |
12,000 |
Medium (50-60mm) |
Balanced acceleration |
|
2.33:1 |
24,000 |
10,300 |
Larger (60-70mm+) |
Maximum thrust, slower top speed |
Matching Ratio to Propeller Load
Here’s a surprise: lower shaft RPM doesn’t mean weak performance. A 2.33:1 reduction might drop your prop to 10,000 RPM. But the torque boost lets you run a 70mm diameter propeller. A direct-drive setup couldn’t move that prop at all. Power absorption scales with propeller diameter to the fifth power. So torque multiplication matters a lot.
Direct drive (1:1) works with small, high-pitch props on very high KV motors. Most RC boats need reduction gearing. Racing cats often run 1.4:1 to 1.7:1 ratios for top shaft speed with moderate prop sizes. Scale tugboats and working vessels use 2:1 to 3:1 reductions. These turn massive scale propellers at realistic speeds.
Calculate your shaft RPM before buying gears. Take your motor’s loaded RPM (typically 70-80% of no-load speed). Divide by your reduction ratio. That number needs to match your propeller’s best operating range. Too slow? You’re wasting power. Too fast? Blade cavitation kills efficiency.
The gear ratio choice sets your boat’s personality. High reduction gives torque and control. Low reduction gives screaming top speed. Throttle adjustment can’t fix a bad match between your ratio and propeller load.
Propeller Diameter and Pitch: How Size Changes RPM
Propeller size controls RPM through mechanical load. Two numbers on every prop—diameter and pitch—create forces that either slow your motor or let it run free.
Diameter measures the circle your propeller blades make. A 15-inch prop cuts a 15-inch circle through water. Add each inch, and blade surface area grows fast. Water resistance jumps too. The physics hits hard: power need scales with diameter to the fifth power. Double your diameter? You need 32 times more power to keep the same RPM.
Real results? Each inch of diameter added drops wide-open throttle (WOT) RPM by 50 to 100 RPM. Move from a 14-inch to a 16-inch prop on the same motor. You lose 100 to 200 RPM at full throttle. The larger disc area creates more drag. Your motor works harder. Speed drops.
Pitch works another way. This number shows how far your prop moves forward in one full turn. Think of it like screw threads. A 19-inch pitch prop moves 19 inches per turn. A 21-inch pitch prop moves 21 inches. Same RPM, different distance covered.
Here’s the catch: each 1-inch pitch boost costs you 200 to 400 RPM at WOT. The effect hits harder than diameter changes. More pitch means steeper blade angles. Steeper angles mean more drag. Your motor slows down fighting that load.
The Diameter-Thrust Link
Diameter doesn’t make your boat faster. It makes it stronger. Larger props create more thrust at lower RPM. They push more water per turn. This helps heavy scale models, displacement hulls, and boats that need quick starts.
Racing catamarans use 40mm to 50mm props for high shaft speeds with low drag. Scale tugboats use 60mm to 70mm props for real torque and pulling power. Your diameter choice sets how your boat performs before you hit the throttle.
Cut diameter and see the flip side. Drop diameter by one inch, and WOT RPM jumps 50 to 100 RPM. Less blade area means less water drag. Your motor spins faster with the same voltage and KV rating. Top speed might go up if your hull can use the extra RPM well.
Pitch: The Speed vs. Acceleration Trade
Pitch sets your top speed at any RPM. The math is simple: take pitch (in inches), times RPM, then divide by 1,056 to get MPH. A 19-inch pitch prop at 6,000 RPM gives you 108 MPH in theory. A 21-inch pitch at the same RPM jumps to 119 MPH.
Theory doesn’t match reality. Propeller slip—the gap between theory and actual forward motion—breaks perfect math. But the link stays true: higher pitch means higher top speed but weaker takeoff. Lower pitch does the reverse.
Here’s where builders waste money. A 15-inch pitch prop works best for about 30 MPH cruising speeds. Push that hull to 60 MPH? You need a 27-inch pitch prop. Use the wrong pitch, and your motor either spins too fast into danger zone or drags below its power range.
|
Pitch Change |
WOT RPM Impact |
Acceleration |
Top Speed |
Best Use Case |
|---|---|---|---|---|
|
-2 inches |
+400 to 800 RPM |
Strong improvement |
Reduced |
Hole-shot, heavy loads |
|
-1 inch |
+200 to 400 RPM |
Moderate gain |
A bit lower |
Better throttle response |
|
Stock |
Baseline |
Baseline |
Baseline |
Manufacturer spec |
|
+1 inch |
-200 to 400 RPM |
Reduced |
Higher potential |
Speed runs, light boats |
|
+2 inches |
-400 to 800 RPM |
Weak |
Maximum potential |
Top speed focus alone |
The Danger Zones: Too Much or Too Little Pitch
Too-low pitch lets your motor hit redline and pass safe RPM. You get fast starts off the line. But top speed drops. The prop can’t turn those high RPMs into forward distance well. Worse? Running above max rated RPM wrecks motor bearings. It burns ESCs. It kills battery cells from too much current draw.
Too-high pitch creates the flip problem. Your motor drags. It can’t reach minimum WOT RPM. The heavy load causes heat in windings. You lose acceleration. The boat fights to get on plane. Engine or drive damage can happen if you keep going.
Manufacturers set target WOT RPM ranges for clear reasons. A brushless outrunner might need 8,000 to 10,000 RPM under load. Your prop choice must hit that range. Miss low? You waste motor power. Miss high? You risk breakdown.
Blade Count Changes Everything
Add blades and your diameter and pitch needs change fast. Going from three-blade to four-blade props takes math, not guessing. Naval architect Dave Gerr’s formula gives the start point: take diameter times 0.94 for the four-blade match.
Real example: A 16-inch diameter × 21-inch pitch three-blade prop changes to about 15-inch diameter × 20.6-inch pitch for a four-blade design. The extra blade adds total surface area. So you cut diameter to keep similar loading traits.
Four-blade props make more thrust at lower RPM. They cut vibration. They boost hole-shot performance. But they also add more drag. Expect to lose 50 to 150 RPM at WOT versus a three-blade prop. The swap works for scale boats and hulls that want smooth running over pure speed.
Some makers offer 1-inch pitch steps. Others jump in 2-inch gaps. That detail matters for fine-tuning. A Mercury REVOLUTION4 prop comes in 15-inch through 25-inch pitch. You can dial in your sweet spot. Cheaper props with 2-inch jumps force trade-offs.
The diameter and pitch numbers stamped on your prop aren’t just guides. They’re the mechanical control on your whole power system’s RPM output. Get them wrong, and no motor voltage or KV change fixes the bad match.
Propeller Slip and Load Conditions: Real-World RPM Reduction Factors
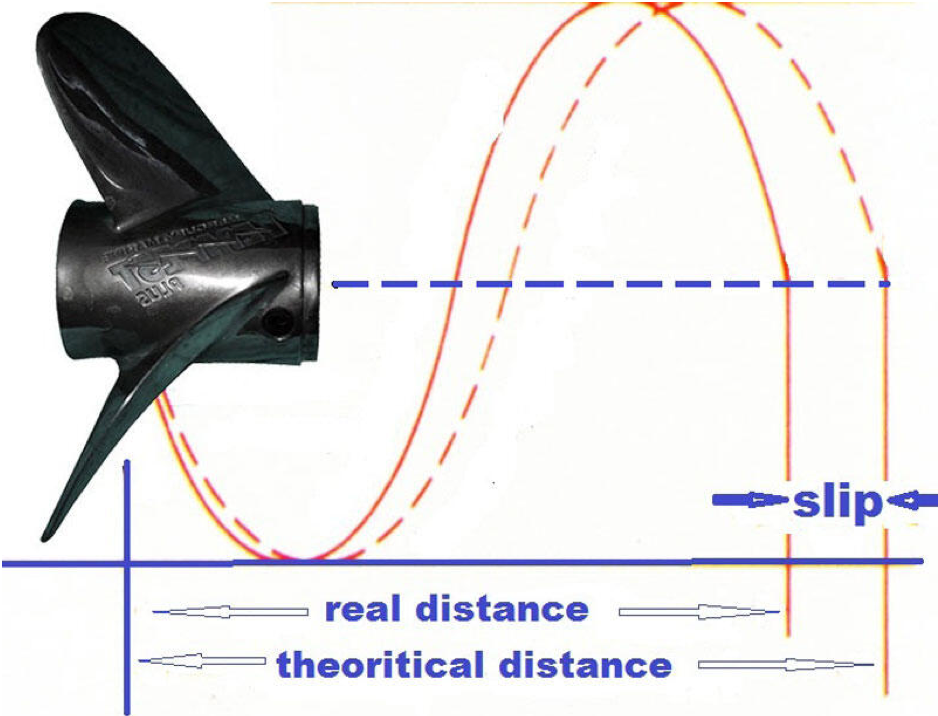
Your prop never moves the boat as far as the pitch number promises. That gap between theory and reality? Propeller slip. This force steals 5% to 45% of your speed. Hull type matters. Water conditions matter. How hard you push matters.
The formula shows the gap: % Slip = 100 × (Theoretical Speed – Actual Speed) / Theoretical Speed. Theoretical speed comes from RPM times pitch divided by 1,056. Actual speed is what GPS shows. The difference tells you how much water your prop loses grip on.
Real numbers make this concrete. A boat running 61.3 mph at 4,300 RPM with a 24-inch pitch prop and 1.36:1 drive ratio should hit 71.8 mph in theory. But it doesn’t. The slip rate? 14.7%. About 15% of thrust gets wasted pushing water backward instead of driving forward.
Hull design sets your slip baseline. Sailboats and displacement barges at 9 mph suffer around 45% slip. They push water aside, not ride over it. The propeller churns hard but converts little into forward motion. Racing hydroplanes above 90 mph? Slip drops to 7% or less. The hull lifts clear. Water contact shrinks. Propeller efficiency jumps.
How Load Conditions Destroy RPM Output
Load increases kill both RPM and efficiency fast. Hull fouling alone raises power demand 20% to 30%. Barnacles and growth add drag. Your motor spins the same voltage and KV rating. But actual shaft RPM drops. The propeller fights harder through dirty water flow.
Here’s the same boat across different throttle positions:
|
RPM |
Actual GPS (mph) |
Theoretical (mph) |
Slip % |
|---|---|---|---|
|
3000 |
39 |
49 |
19% |
|
3500 |
48 |
~56 |
14% |
|
4600 (WOT) |
61 |
~74 |
18% |
Notice slip drops mid-range then climbs again at wide-open throttle. The lowest slip happens at optimal planing attitude. Push past that sweet spot? Resistance climbs. Slip increases. RPM can’t overcome the load penalty.
Over-pitching creates another common trap. You install a prop with too much pitch for your motor’s power curve. The engine can’t reach target WOT RPM. It drags below the efficient range. Heat builds in windings. Slip jumps. The blade angle exceeds what available torque can drive through water.
Environmental factors make the problem worse:
-
Shallow water creates squat effect—the hull sinks deeper, resistance spikes
-
Head winds and waves add tons of extra load without changing your prop setup
-
Heavy currents force the propeller to work against moving water mass
-
Excessive stern trim lifts the bow but buries the transom, killing efficiency
Each condition steals RPM from your math. Your motor might show 8,000 RPM on the bench. Put it in rough water with a fouled hull? You see 6,500 RPM and wonder why performance tanked.
The Transition Zone: Maximum Slip Point
Moving from displacement to plane creates the worst slip of any condition. Your hull is climbing its own bow wave. Stern drag peaks. The propeller churns through disturbed, aerated water. Slip can hit 25% to 35% in this phase.
Break through onto plane? Slip drops right away. The hull rises. Wetted surface shrinks. Water flow to the propeller smooths out. You start converting thrust into forward motion instead of fighting wave-making resistance.
This explains why builders obsess over getting boats “on step” fast. Less time in transition means less time burning power at terrible slip rates. Larger diameter props with slight cup designs grip better during this phase. They cut slip 2% to 4% compared to flat-blade props of the same pitch.
High-performance racing props achieve 5% slip or less using mid-chord pitch standards. Mechanical efficiency runs 60% to 70% in these setups. Compare that to a bad prop match showing 20% slip and 45% mechanical efficiency. You lose more than half your motor’s work to wasted water movement.
Measuring and Optimizing Slip
Test on calm days with zero wind, waves, or current. Record GPS speed across your full RPM range—not just wide-open throttle. Calculate slip at each point. The pattern shows where your setup works and where it fails.
Target slip in the low teens percentage at WOT for good efficiency. Anything above 20% signals setup problems. Check stern trim first. Too much bow lift kills propeller bite. Inspect your hull bottom for growth. Verify prop pitch matches your motor’s power curve.
Slip reduction translates to RPM recovery. Cut slip from 18% to 12%? Your shaft speed just jumped 6%. That’s free performance from setup work, not new parts.
ESC Settings and Motor Efficiency: Electronic Factors Affecting RPM
Your Electronic Speed Controller does more than pass voltage between battery and motor. It transforms DC power into precise AC timing. It controls switching frequencies. And it determines how much battery energy reaches the propeller shaft as useful rotation.
ESC efficiency variance alone creates a 10% performance gap between identical motor setups. Two boats with the same motor, battery, and propeller can show 800 to 1,200 RPM differences. This comes purely from ESC quality and setup. The controller’s switching method, PWM frequency, and timing advance all change how electrical power becomes mechanical shaft speed.
Benchmark testing across 48 brushless motors shows the efficiency equation. The motor-ESC system averages 77.64% peak efficiency. But that number hides a massive range from 55.79% to 97.61%. Your ESC settings place you somewhere in that spectrum. Poor setup dumps watts into heat instead of thrust. Good tuning pushes efficiency above 85%. This gives you higher sustained RPM under load.
PWM Switching Rate: The Hidden RPM Stabilizer
PWM (Pulse Width Modulation) frequency controls how fast your ESC switches power on and off to the motor windings. Most cheap controllers run 8 kHz switching. Better units offer 16 kHz to 32 kHz rates. Racing ESCs push beyond 48 kHz.
Higher PWM rates deliver smoother power pulses. The motor experiences less electrical “ripple” in its magnetic field. Dyno testing shows clear efficiency gains as PWM rate climbs. Peak performance hits between 24 kHz and 32 kHz for most brushless outrunners. Push beyond that sweet spot? Switching losses from the ESC’s FETs start eating gains.
The RPM impact shows up under sustained load. Low PWM rates create tiny fluctuations in shaft speed. Your tachometer might read 8,000 RPM average. But rotation pulses between 7,850 and 8,150 RPM many times per second. Water resistance turns these fluctuations into performance loss.
Bump PWM rate from 8 kHz to 24 kHz? You cut those speed variations in half. The propeller maintains steadier bite through water. Heat generation drops in both ESC and motor windings. Battery voltage sag under load improves because current draw smooths out.
Timing Advance: Trading Safety for Speed
ESC timing controls when voltage hits each motor phase relative to rotor position. Conservative timing (0° to 15°) keeps the magnetic field a bit behind rotor rotation. Aggressive timing (20° to 30°) pushes field timing ahead of the rotor.
Higher timing advance increases RPM at the same throttle position—but it costs you. Advanced timing creates harder magnetic “pulls” that generate more heat. Efficiency can drop 2% to 5% even as shaft speed climbs 300 to 500 RPM. The motor works against stronger back-EMF forces.
Racing setups often run 25° to 30° timing for maximum RPM extraction. The trade-off? Motor temperatures jump 15°C to 25°C hotter. ESC heat rises too. You need aggressive cooling and short run times. Weekend boats should stay at 10° to 15° timing for sustainable performance.
Wrong timing creates another problem: cogging and rough acceleration. Too much advance and your motor jerks during throttle transitions. The magnetic timing fights rotor momentum. You feel it as stuttering power delivery. You hear it as uneven motor noise.
Telemetry Feedback: Real-Time RPM Optimization
Modern ESC protocols like DShot enable two-way communication. Your controller sends throttle commands. The motor sends back real RPM data (eRPM), current draw, voltage, and temperature. All through a single signal wire.
This feedback loop changes setup work. You see real shaft RPM instead of guessing from voltage and KV math. Set your MOT_POLE_COUNT parameter right (14 poles for most RC boat motors). The ESC calculates precise mechanical RPM from electrical frequency.
Real example: Your math predicts 9,200 RPM at full throttle. Telemetry shows 8,650 RPM. That 550 RPM gap tells you about propeller load, voltage sag, or efficiency losses. Adjust prop pitch down one inch. RPM jumps to 9,100 RPM. Now you’re within 100 RPM of target.
CAN bus interfaces take telemetry further for professional setups. You log every parameter across full speed runs. Temperature spikes reveal cooling problems. Current peaks show where the motor lugs under load. Voltage drop patterns expose weak battery cells before they fail mid-race.
The Motor-ESC Efficiency Curve
Efficiency changes across your throttle range. Peak numbers happen at specific RPM and torque pairings. This is 60% to 75% of maximum power output. Push to wide-open throttle? Efficiency drops as heat losses climb with the square of current (I²R formula).
Heavier motors show better peak efficiency in benchmark testing:
-
3.9g to 30g motors: 70.8% average max efficiency
-
70g to 159g motors: 82.78% average max efficiency
-
1,093g to 5,130g motors: 85.42% average max efficiency
The pattern holds because larger motors spread heat across more winding mass and surface area. But your ESC settings determine where on each motor’s efficiency curve you operate. Poor ESC setup can drop a theoretical 85% efficient motor down to 72% real-world output.
Here’s where tuning pays off: Match your typical cruising RPM to the motor’s peak efficiency point. Run dyno tests or review manufacturer efficiency maps. Peak efficiency hits at 7,500 RPM and 65% throttle? Choose a propeller that loads the motor to that operating point for your target speed. You extract maximum range and minimum heat.
Racing reverses the logic. You want the maximum power point. Full potential regardless of efficiency losses. Accept the heat. Accept the 15% efficiency drop at WOT. Optimize ESC timing and throttle curve to hit absolute peak RPM and current draw. Just make sure cooling can handle the thermal load for your run duration.
RPM Optimization Strategy: Balancing Speed, Acceleration, and Control
Maximum RPM doesn’t win races. Smart RPM distribution does.
Your boat faces three competing demands every second on the water. You need straight-line speed for the straights. You need brutal acceleration out of turns. You need precise throttle control for positioning. Traditional constant-RPM tuning forces you to pick one. Racing setups sacrifice low-end grunt for top speed. Scale boats trade acceleration for steady cruising. You shouldn’t have to choose.
Advanced control strategies change this equation. Research on electric powertrains shows torque performance jumps 22% by replacing basic Zero Direct-Axis Current (ZDAC) control with Maximum Torque Per Ampere (MTPA) techniques. The difference? MTPA adjusts current vector positioning in real-time. This extracts maximum torque from whatever current your battery delivers. ZDAC just dumps current straight into the motor. No optimization.
The Three-Zone Performance Map
Break your throttle range into distinct zones. Each zone needs different RPM characteristics:
Launch and Acceleration Zone (0-40% throttle): This phase demands maximum torque, not maximum RPM. MTPA control strategies prove their worth here. Cornering exits and overtaking maneuvers need instant response. Your motor controller adjusts d-axis and q-axis current references. The result? The propeller shaft gets 20% more torque from the same battery current compared to fixed control methods.
Transition Zone (40-70% throttle): Your boat climbs onto plane. Hull attitude changes. Water resistance shifts from displacement drag to planing friction. This zone kills most setups. They optimize for endpoints—either low-speed torque or high-speed RPM. They ignore the middle. Intracycle RPM variation strategies borrowed from large wind turbine control offer solutions. The controller varies shaft speed within each propeller rotation to match blade loading. No fighting to maintain constant RPM through changing loads. You maintain thrust efficiency while hull dynamics shift underneath you.
Top Speed Zone (70-100% throttle): Pure RPM extraction rules this range. But here’s the catch: flux weakening control becomes critical once motor speed exceeds base speed. That’s around 16,000 RPM for RC boat motors. The controller injects negative d-axis current to reduce back-EMF. This extends your RPM ceiling. The formula looks complex but the effect is simple—your top-end RPM increases 8% to 12% without changing motor voltage or KV rating.
Load Balancing for Dual-Motor Setups
Twin motor boats face another optimization layer. Poor torque distribution wastes 15% to 25% of total power output. One motor lugs while the other spins without resistance. Heat builds in the overloaded unit. Efficiency tanks across both motors.
Rule-based control strategies using ‘if-then’ logic solve this fast. The system monitors current draw across both motors in real-time. The difference exceeds 10%? The controller shifts load toward the underutilized motor. You maintain equal wear rates. Total system efficiency climbs because both motors operate closer to their peak efficiency points. No more one maxed out and one coasting.
This same logic extends to four-wheel-drive RC vehicles. It translates to catamaran hulls running dual outdrives. The general torque distribution approach improves drivetrain efficiency by moving power between energy sources based on conditions—turn angle, hull trim, wave impact, or propeller ventilation events.
Practical Tuning Steps
Programming advanced motor control requires compatible ESCs with adjustable parameters. But even basic programmable controllers let you implement simplified versions:
Set separate throttle curves for different usage scenarios. Create an “acceleration” profile with aggressive low-end response. Activate flux weakening sooner. Build a “top speed” profile that smooths mid-range transitions and extends high-RPM operation. Most racing ESCs store three to five profiles you can switch between.
Monitor motor temperature across your throttle range. Hot spots reveal where your current setup fights against optimal efficiency. A motor hitting 75°C at 60% throttle but 65°C at 85% throttle? Your mid-range tuning is wrong. The controller is forcing inefficient current distribution through that zone.
Test across your usage pattern—not just full-throttle blasts. Optimization algorithms like Covariance Matrix Adaptation Evolution Strategy (CMA-ES) handle complex, nonlinear efficiency problems. They determine optimal current ratios across your complete operating envelope. Professional racers use these tools to extract the last 3% of performance. Weekend pilots benefit more from understanding the three zones. Tune for realistic mixed-throttle use.
The goal isn’t maximum RPM at wide-open throttle. It’s maximum usable performance across the conditions you face—launches, transitions, sustained speed, and the throttle modulation that separates good boat handlers from average ones.
RPM Calculation Tools and Practical Examples
Numbers on paper mean nothing until you test them on water. Running blind costs time and parts. Calculation tools bridge theory and reality. They predict your propeller’s behavior before you order components or burn out a motor.
Basic RPM Formula for RC Boats
Here’s the core equation: Propeller Shaft RPM = (Motor KV × Battery Voltage) ÷ Gear Ratio. This gives theoretical no-load speed. Real loaded RPM drops 20% to 30% below that number once water resistance hits.
Example setup breakdown:
– Motor: 2300 KV rating
– Battery: 4S LiPo at 14.8V nominal
– Gear ratio: 1.5:1 reduction
Calculation: (2300 × 14.8) ÷ 1.5 = 22,693 RPM theoretical shaft speed
Expect actual loaded RPM around 15,900 to 18,150 RPM with a matched propeller. The gap comes from propeller load, water drag, and voltage sag under throttle.
Mobile RPM Calculator Apps
RPM Revolutions Calculator handles multiple conversion types in one tool. The speed-to-RPM function uses RPM = (velocity × 60) ÷ (2π × radius). Plug in your boat’s GPS speed and propeller radius. The app shows actual shaft rotation.
Belt and pulley calculations help you understand gear reduction effects: RPM_output = RPM_input × (diameter_input ÷ diameter_output). A 20mm drive pulley spinning 24,000 RPM connected to a 30mm output pulley gives 16,000 RPM output. Same physics as gearbox reductions. Different hardware.
The app handles unit conversions for you. Feed it mph or kph. Get RPM results without manual math. Quick field checks become easy. Testing different propeller combinations at the lake? This helps.
Encoder-Based RPM Measurement
Builders use optical encoders for precision measurement. The formula connects encoder frequency to shaft speed: RPM = (Frequency × 60) ÷ CPR. CPR means Counts Per Revolution. This shows how many pulses your encoder sends per full rotation.
Real measurement example:
– Encoder frequency: 1000 Hz
– Encoder CPR: 1024 pulses per revolution
– Calculated RPM: (1000 × 60) ÷ 1024 = 58.6 RPM
Flip the formula to verify your setup. You claim 1800 RPM with a 500 CPR encoder? Expected frequency = (1800 × 500) ÷ 60 = 15,000 Hz. Match your measurement tools to expected values before testing. Mismatched CPR settings give garbage data.
PicoScope RPM Measurement via Ignition Signal
PicoScope oscilloscopes measure RPM through electrical signals. The math channel formula reads: Engine RPM = 60 ÷ 0.5 × freq(A). Channel A captures your motor’s Hall sensor signal or ESC PWM output. Use an 8 kHz lowpass filter to clean noise.
This method works for brushless motors sending telemetry. The electrical frequency reflects mechanical rotation. Download pre-configured .psdata files for instant setup. No manual formula entry needed. Just connect your probe and read RPM in real-time.
Gearbox Output Calculation
Every reduction gear changes your final shaft speed. The equation stays simple: Output RPM = Input RPM ÷ Gear Ratio. Motor spinning 24,000 RPM with a 2:1 gearbox delivers 12,000 RPM to the propeller shaft. A 1.5:1 ratio gives 16,000 RPM. A 2.33:1 ratio drops it to 10,300 RPM.
Test across your full throttle range. Motor RPM varies with load. Measure at 25%, 50%, 75%, and 100% throttle positions. Plot the curve. You’ll see where efficiency peaks. You’ll also see where your setup fights propeller resistance.
Synchronous Motor RPM (Baseline Reference)
Synchronous AC motors follow strict speed rules. The formula: (Hz × 60 × 2) ÷ Number of Poles = RPM. A 4-pole motor at 60 Hz electrical frequency runs at 1800 RPM. A 2-pole motor at 50 Hz hits 3000 RPM.
RC boat brushless motors aren’t synchronous. They’re permanent magnet designs. But this calculation shows the theoretical ceiling. Your outrunner’s electrical frequency sets maximum possible speed. ESC timing adjustments shift performance within that boundary. You can’t exceed the physics limit without changing pole count or electrical frequency.
Conclusion
Mastering RC boat propeller RPM isn’t about chasing random numbers. It’s about knowing how motor KV rating, battery voltage, gear ratios, and propeller specs work together. Each part of your power system affects the others. Get them balanced right, and your boat performs like magic on the water.
The best part? No more guessing. You’re tuning for speed runs or extending cruise time? You now have the technical base to make smart choices instead of costly errors. Calculate your theoretical propeller rotation speed. Account for real-world slip. Then adjust step by step.
Here’s your next move: check your current setup with the formulas we’ve covered. Find your weakest link. Is voltage holding you back? Maybe your gear ratio doesn’t match. Or an oversized propeller is choking your motor? Fix that one bottleneck. You’ll see gains right away. The water doesn’t lie. These principles don’t either. Get out there and make those adjustments count.